

Business Intelligence
Transform your data into strategic decisions! With our customized Power BI reports, get a clear and detailed view of business performance.
Transform data into strategic decisions
In today's data-driven world, having advanced tools to analyze and interpret data is essential. Excel's advanced features, such as Power Pivot and Power Query, represent the ideal starting point for structuring a solid approach to Business Intelligence.
With Power Pivot you can combine and analyze large volumes of data from different sources, creating complex models and interactive reports that offer a clear and in-depth view of business performance.
Power Query, on the other hand, automates data import, cleaning and transformation processes, reducing the risk of manual errors and ensuring information flows that are always up-to-date and reliable.
These tools, integrated with solutions like Power BI, allow you to obtain strategic insights in real time, improve operational efficiency and support faster, informed and growth-oriented decisions.
Customized Dashboards and Reports
Tailored solutions to monitor and analyze business performance
Optimize your company with customized reports created according to your key indicators! Thanks to Microsoft's Power BI, you'll have access to interactive dashboards and customized reports, automatically updated and accessible from mobile devices too.
Analyze performance, monitor sales and make strategic decisions in real time, easily integrating different data sources. Don't settle for generic reports: transform your data into concrete opportunities!
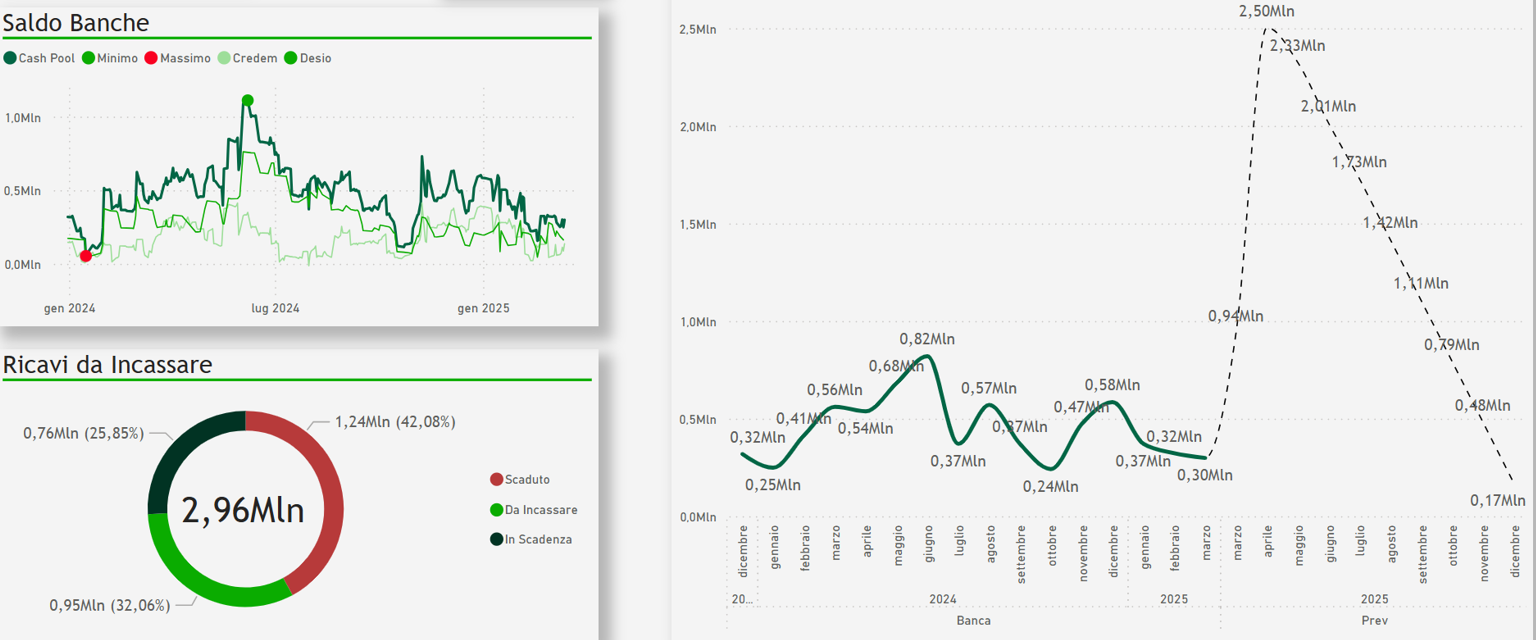
Customized Dashboards
View your most important data in real time through intuitive and customized dashboards, specifically designed for your business needs.
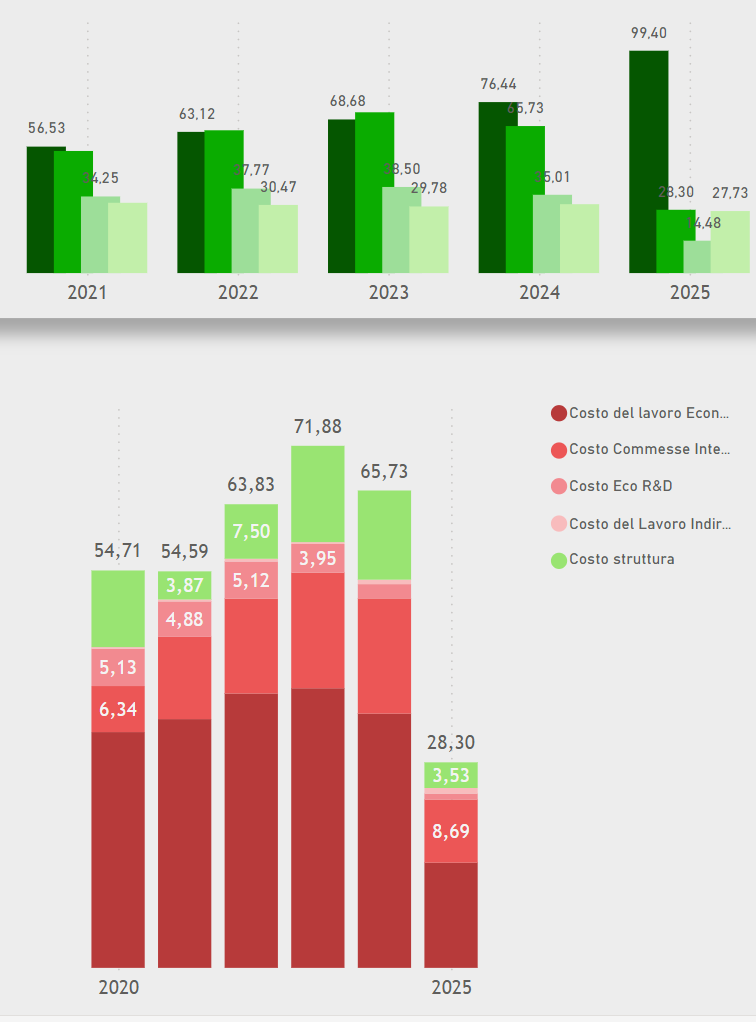
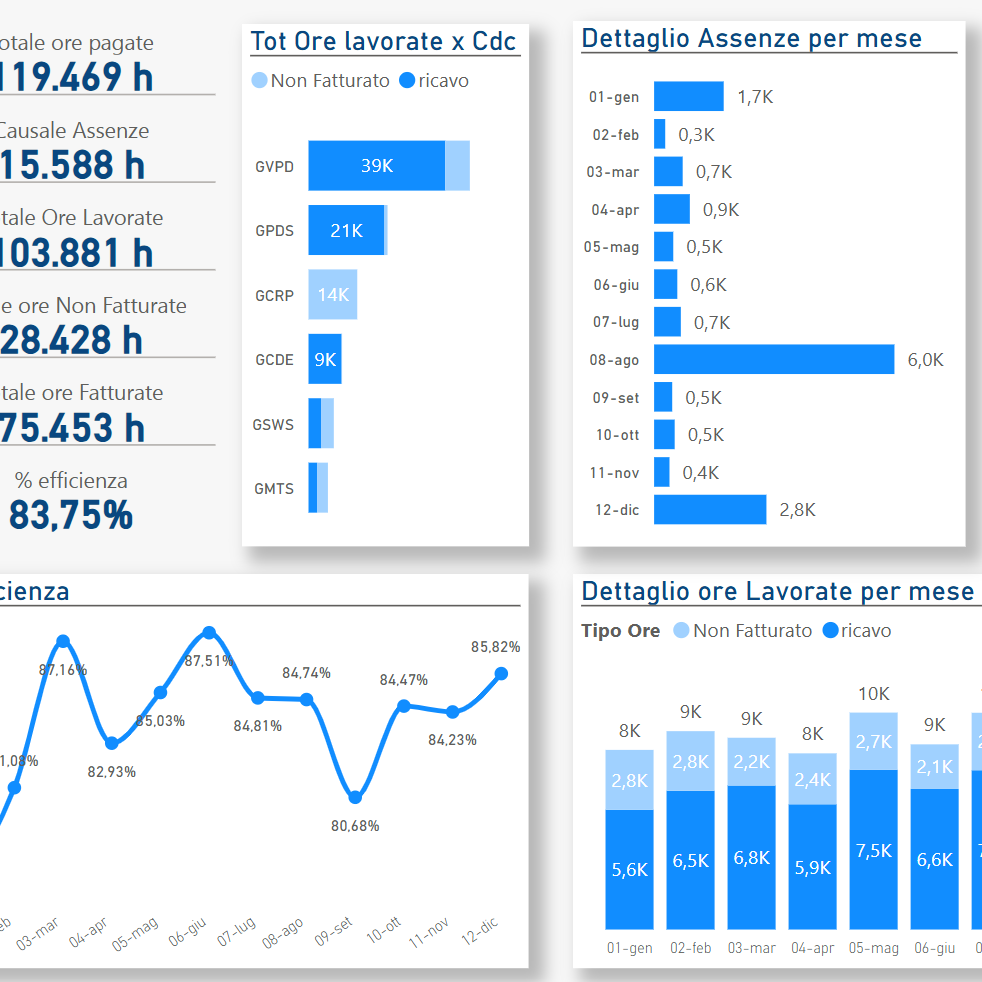
Analytical Reports
Generate detailed and in-depth reports that help you understand your company's performance and identify growth opportunities.
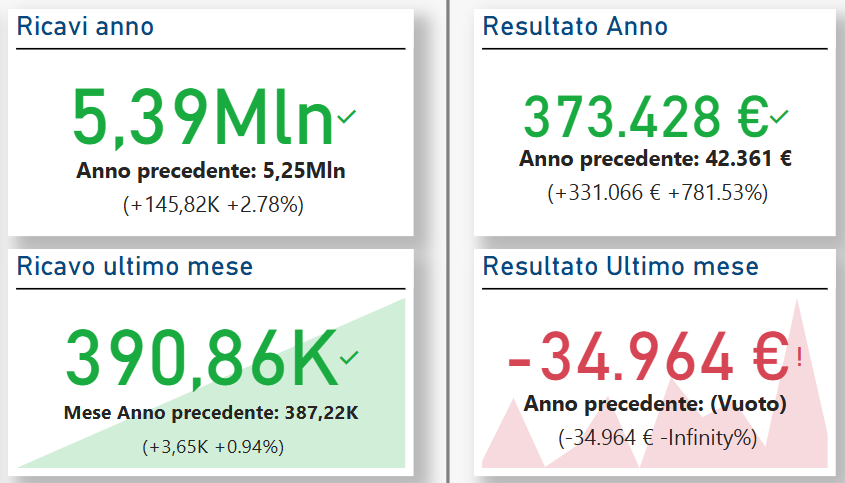
KPIs and Metrics
Monitor the most relevant key performance indicators (KPIs) for your business, with clear and immediate visualizations.